


Empowering Sustainability in Manufacturing: Illuminate™ Energy and Emissions Add-on Module
Jul 22, 2024

ATS Global Service is dedicated to helping customers make informed decisions on optimizing their manufacturing operations. This is why we designed the Illuminate™ Energy and Emissions Add-on Module for Illuminate™ Manufacturing Intelligence software: to give customers the revelatory data they need on energy consumption, and CO2e and CO2 emissions produced by their plant. The software is geared towards helping manufacturers improve sustainability as part of environmental, social and governance initiatives. With data-driven operational visibility, plant managers now have meaningful insights at their fingertips. The module also helps save on costs that would amount from collecting and generating data required for sharing, planning and reporting.
We are committed to understanding the operational challenges faced by today’s manufacturers and their evolving needs with respect to industrial automation and lifecycle asset management. A customer conversation about the substantial time and resources to collect information on energy consumption led to the development of the Illuminate™ Energy and Emissions Add-on Module. Other key factors are the increasing adoption of sustainable manufacturing practices, along with stringent regulatory and commercial imperatives.
Use Actionable Information to Drive Change

Equipped with informative, at-a-glance dashboards, the software provides real-time granular details such as per machine and per part energy consumption. The software is highly versatile and configurable to capture the exact details and insights you want on energy, CO2e, and CO2 emissions at any output rate, for any machine zone or entire factory. This includes electrical and pneumatic energy consumption with details on good and rejected parts, for cost of scrap accounting. Plant managers can use the module to calculate results over specified time periods and on machines producing different products, giving comparative results across machines.
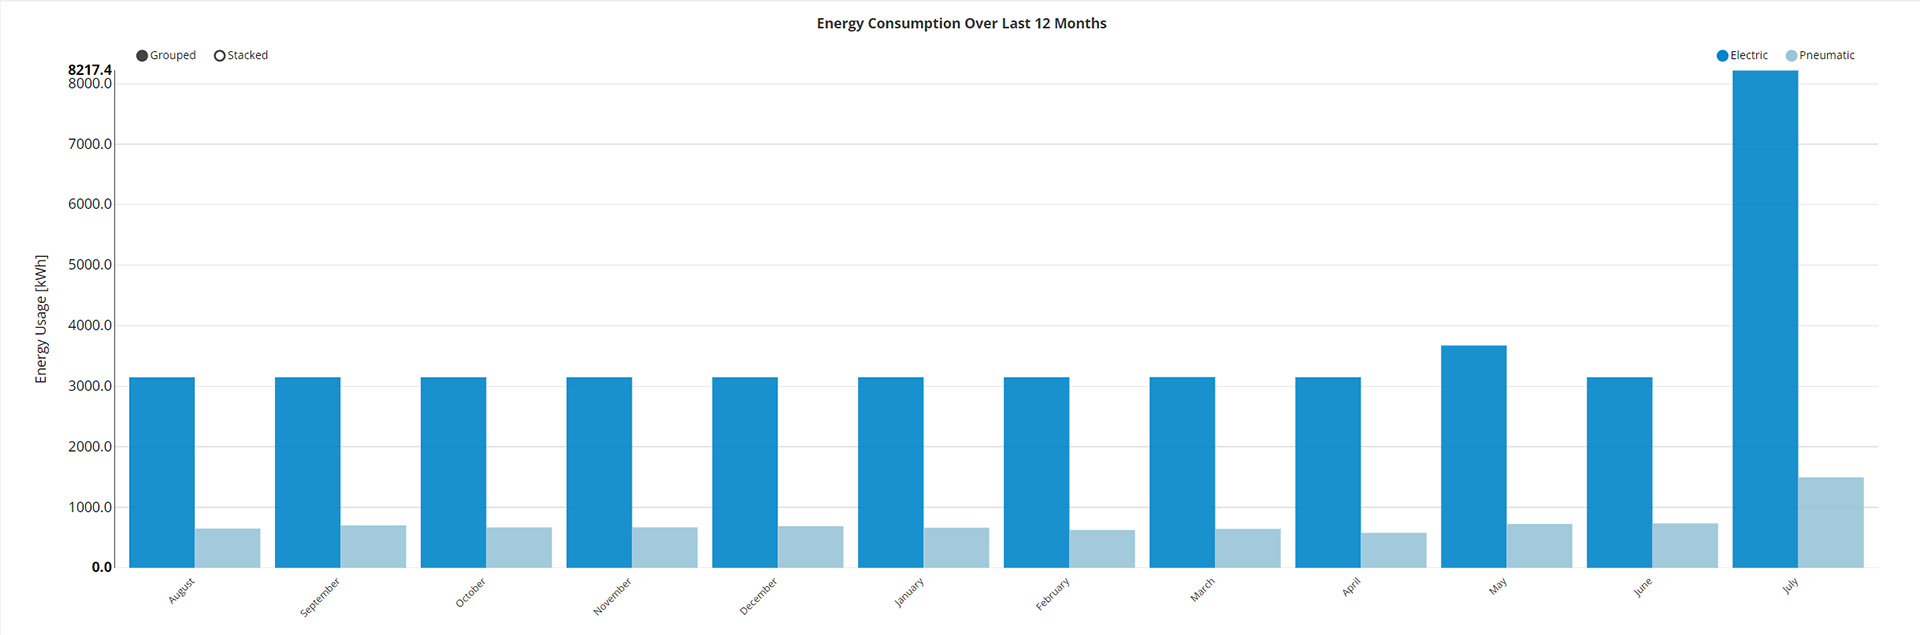
This graph shows grouped information for both pneumatic and electrical energy over a twelve-month period. The increase of energy usage in July may cause a plant manager to investigate which machine processes were producing these high volumes. As a result, plant managers may decide if, or how energy emissions can be reduced. The information is also available in stacked format for different viewing options.
Features and Benefits to Support your Best Practices
- Energy and Emissions Dashboard: View at-a-glance consumption of pneumatic and electrical energy
- Energy Dashboard: Review granular details on per part and per machine energy consumption over the last 12 months to make informed decisions
- Carbon Footprint Dashboard: View your overall footprint including electrical, pneumatic and manufactured components; incorporate this data into your ESG
- Measurement Log: Calculate machine deviations in voltage, power, frequency and energy to view trends in energy consumption
- Scrap Report Functionality: Identify ways to reduce CO2 emissions from rejected scrap
“CO2e is the universal unit of measurement to indicate the global warming potential (GWP) of each greenhouse gas, expressed in terms of the GWP of one unit of carbon dioxide. It is used to evaluate releasing (or avoiding releasing) different greenhouse gases against a common basis.” (World Resources Institute and World Business Council for Sustainable Development. September 2011)
Contact us to learn more about how you can integrate the Illuminate™ Energy and Emissions Add-on Module into your operations.
Source:
Greenhouse Gas Protocol. Corporate Value Chain (Scope 3) Accounting and Reporting Standard: Supplement to the GHG Protocol Corporate Accounting and Reporting Standard. USA: World Resources Institute and World Business Council for Sustainable Development, 2011.